- Published on
Market & Astrology Briefing: SPY and QQQ Technical Stance Ahead of the Open
- Author
- Name
- AstroStock
- 3 min read0 views
A data-driven technical briefing on SPY and QQQ levels from the September 14, 2026 session, alongside cycle research frameworks.
Equity benchmarks pulled back during the regular session on September 14, 2026, with major exchange-traded funds settling lower ahead of the next trading day. The last available regular-session quote for the State Street SPDR S&P 500 ETF Trust (SPY) stood at $760.88, reflecting a decline of 0.45% (-$3.41) on a trading volume of approximately 43.54 million shares.
The Invesco QQQ Trust (QQQ) experienced a similar retreat, closing the regular session at $709.18, down 0.80% (-$5.70) with roughly 34.62 million shares traded. Both instruments settled within their respective daily ranges as market participants evaluated near-term technical levels.
Technical Structure and Reference Levels
Provider technical reference levels from Trading Central highlight clear boundaries for current price action. For SPY, key overhead resistance is identified at $767.46, with model stop-loss parameters placed at $746.96 and deeper support calculated at $682.12.
For QQQ, the nearest provider resistance sits at $716.65, above the last regular-session close of $709.18. Key support remains established at $624.03, alongside a reference stop-loss level of $676.22.
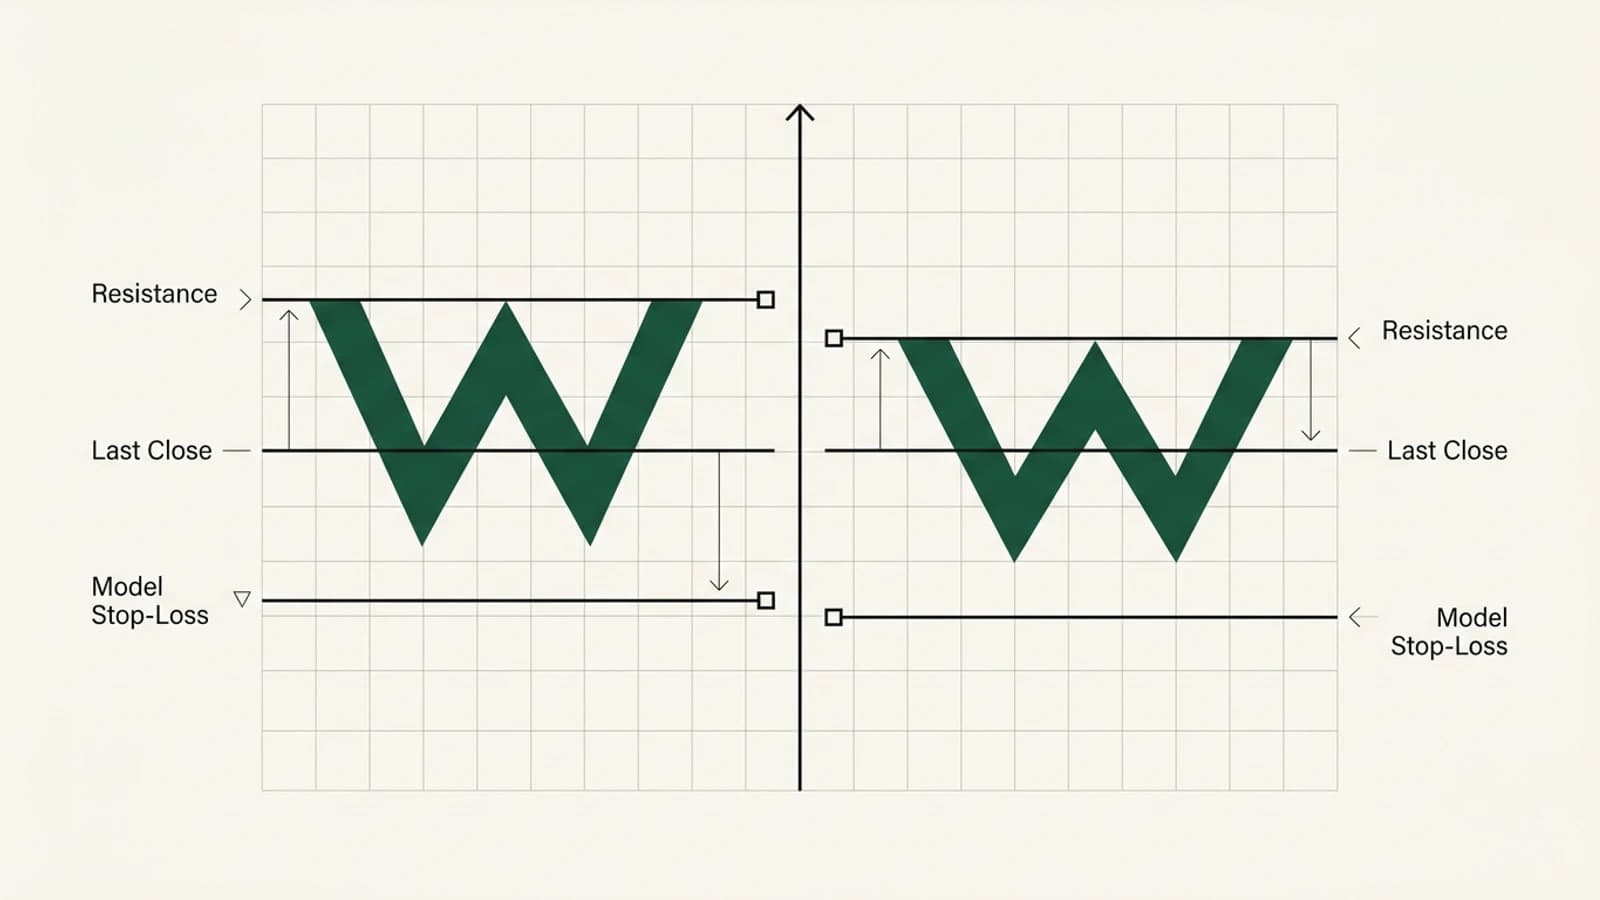
- SPY: Last close $760.88; resistance at $767.46; model stop-loss at $746.96.
- QQQ: Last close $709.18; resistance at $716.65; model stop-loss at $676.22.
Multi-Timeframe Trend Outlooks
Trading Central technical event models show diverging time-horizon dynamics across both major indexes. SPY displays a short-term bearish outlook based on recent technical events outweighing bullish indications, while its intermediate-term stance remains neutral and its long-term posture maintains weak bullish evidence.
QQQ presents a neutral short-term technical score, though its intermediate-term profile registers bearish evidence as recent downside events outweigh constructive patterns. Like SPY, QQQ retains a weak bullish direction over the long-term horizon.
Cycle Framework and Methodology
AstroStock treats financial astrology and cycle analysis strictly as timing hypotheses to test against empirical price action, rather than as causal drivers of market moves. Planetary geometry, moon phases, and astronomical cycles provide potential inflection windows that require direct confirmation from price structure, volume, and momentum indicators.
In the current calendar feed, specific planetary events are unavailable for the active session. Under our research protocol, analysts monitor how price behaves around established horizontal levels rather than anticipating untested cyclical turns.
Research Takeaways
Both SPY and QQQ trade below nearby overhead resistance following recent session declines. Traders observing cycle hypotheses should watch the defined resistance boundaries at $767.46 for SPY and $716.65 for QQQ to confirm whether current short-term weakness stabilizes.
For educational purposes only; not financial advice.
Source: AstroStock stock API. Regular-session quotes: SPY as of 2026-09-14 20:00:00 UTC; QQQ as of 2026-09-14 20:00:00 UTC. Data may be delayed; closed markets show the last available session.