astrostock
  • Analysis

    • Charts WorkspaceChart price, indicators, and market context
    • Stock ScreenerFind stocks with 34 ready-made scans
    • Research WorkspaceCompare past events, related markets, and possible paths
    • Weekly Market ReportsGann dates & levels, every week

    Institutional Flow

    • Dark Pool PrintsReview large off-exchange trades
    • Smart Flow ScannerReview unusual options beside other signals
    • Gamma SqueezeSee where options hedging may add pressure

    Modules

    • Gann AnalysisMap price levels and dates from key pivots
    • Financial AstrologyPlace market-timing events on the chart
    • Price GeometryCarry price and time relationships forward
    • Harmonic TraderFind patterns and plan entries, exits, and stops
    • Cycle SuiteSee repeating rhythm and possible turning areas
    • StatisticalCheck trend, stretch, comparisons, and possible ranges
    • Extremes SuiteSpot stretched moves and wait for confirmation
    • Adaptive FiltersSeparate the broader trend from shorter cycles
    • PositioningSee how major futures trader groups are positioned
    • AI Trading ToolsGet a second opinion and test an idea
    Live demo available|132+ drawing tools · 57 chart panels
    View plans
  • Pricing
  • FAQs
  • Blog
  • Docs
    • Sign in
    • Sign up

astrostock is for informational and educational purposes only and does not constitute financial, investment, or trading advice. Past performance is not indicative of future results. Always consult a qualified financial advisor before making investment decisions.

astrostock

Find opportunities, understand the chart, check an idea, and monitor what changes from one research workspace.

This site is protected by reCAPTCHA and the Google Privacy Policy and Terms of Service apply.

Platform

  • Charts Workspace
  • Stock Screener
  • Research Workspace
  • Weekly Market Reports
  • Dark Pool Prints
  • Smart Flow Scanner
  • Gamma Squeeze

Modules

  • Gann Analysis
  • Financial Astrology
  • Price Geometry
  • Harmonic Trader
  • Cycle Suite
  • Statistical
  • Extremes Suite
  • Adaptive Filters
  • Positioning
  • AI Trading Tools

Resources

  • Pricing
  • Blog
  • Weekly Market Reports
  • Docs
  • FAQs
  • Redeem Code

Company

  • About
  • Contact us

Policies

  • Terms & Conditions
  • Privacy Policy
  • Refund Policy
  • Disclaimer

Copyright © 2026 astrostock. All rights reserved

Live demo available|SSL encrypted

HomeBlog

SPY and QQQ Market Briefing: Technical Extension Meets Full Moon Cycle Window

Published on
September 22, 2026

SPY and QQQ Market Briefing: Technical Extension Meets Full Moon Cycle Window

A technical and cycle analysis briefing on SPY and QQQ levels following the September 21 session, highlighting the upcoming September 26 Full Moon window.

Author
Name
AstroStock
2 min read·342 views
SPY and QQQ Market Briefing: Technical Extension Meets Full Moon Cycle Window

U.S. equities saw strong upward momentum in the previous regular session, with major index benchmarks advancing alongside heavy volume. As pre-market trading gets underway, technical levels and upcoming lunar cycle markers outline key reference zones for research.

Benchmark Technical Context

In the last regular trading session ending September 21, 2026, the SPDR S&P 500 ETF Trust (SPY) advanced 1.55% (+$11.81) to close at $773.50 USD on a volume of approximately 49.31 million shares. The Invesco QQQ Trust (QQQ) posted a stronger gain, rising 2.88% (+$20.77) to close at $741.47 USD with about 46.23 million shares traded.

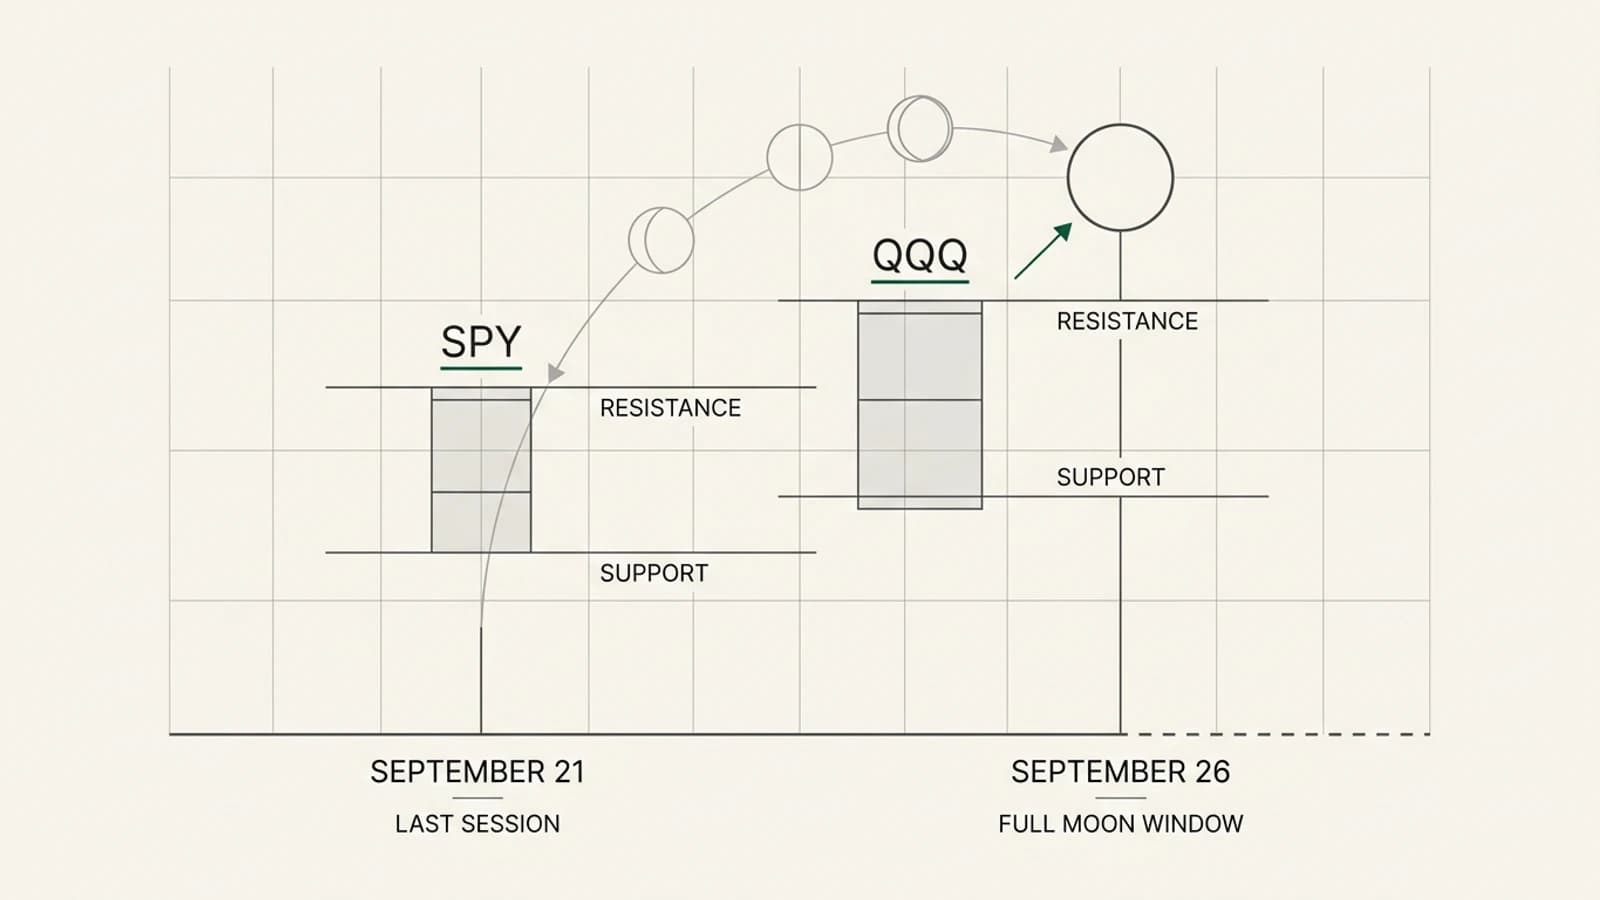
Both instruments sit near the upper end of their 52-week ranges ($629.28 to $779.37 for SPY; $555.60 to $748.65 for QQQ). Undated provider reference levels from Trading Central place overhead resistance at $776.85 for SPY and $745.65 for QQQ, while technical support levels are identified at $682.12 and $713.29 respectively.

Cycle Timing and Lunar Hypothesis

According to the astronomical calendar, the next scheduled cycle event is a Full Moon on September 26, 2026 (UTC). In financial astrology and cycle analysis, lunar phases are not treated as direct physical causes of market moves. Instead, they serve as empirical timing hypotheses used to observe potential sentiment extremes, momentum shifts, or volatility clusters around specific dates.

Because other planetary datasets (such as ingresses, retrogrades, and aspects) are currently unavailable in the feed, analysis focuses strictly on the upcoming lunar event as a calendar reference window.

Research Takeaway and Execution Framework

With SPY and QQQ testing areas close to their respective provider resistance levels ($776.85 and $745.65), traders evaluating cycle hypotheses can monitor order flow and price action for potential consolidation or exhaustion as the September 26 Full Moon approaches.

  • Support Verification: Keep reference support levels ($682.12 for SPY, $713.29 for QQQ) in view if short-term pullbacks emerge.
  • Cycle Correlation: Track volume and range expansion around September 26 to test whether lunar inflection hypotheses demonstrate statistical relevance in current market conditions.

For educational purposes only; not financial advice.

Source: AstroStock stock API. Regular-session quotes: SPY as of 2026-09-21 20:00:00 UTC; QQQ as of 2026-09-21 20:00:00 UTC. Data may be delayed; closed markets show the last available session.

Tags

Technical AnalysisSPYQQQFull MoonCycle Research
Share